
Ask your stack why.
Your entire infrastructure stack, one conversation away.
All your observability, cost, deploy and security signal in a single MCP server. Vendor-agnostic: Datadog, Grafana, SigNoz; AWS, GCP, Magalu Cloud; GitHub, Vercel, Argo CD. Whatever your team uses that isn't here yet, we connect in the same pattern. Works with any MCP client (Claude, ChatGPT, Cursor). Correlated context, not API dumps.
Context composition, not MCP orchestration
Four design principles that change the pace of an investigation or audit. From "open 8 tabs and correlate by hand" to "one call that returns the full story".
Composition over granularity
A single tool like investigate_incident already cross-references APM traces, monitors, pod metrics and recent deploys in one call, regardless of which vendor sits behind it. Your AI gets the case ready to reason about, not the loose pieces.
Your entire stack behind a single interface
Observability, cloud, source, product analytics, quality, tickets, messaging, data: all behind one interface, regardless of vendor. IDs (commit, deploy, span, order) become automatic bridges between the sources your team already uses.
Read-only by design
Infrastructure connectors don't expose write methods at all. The only 5 tools with write side effects create records in Jira, Slack and GitHub issues, and they require explicit confirmed: true on every call. Your infra never changes by chat accident.
Keeps working when something fails
If one of the sources is down, the investigation keeps running with what's available, and the report clearly flags what was missing. Your production analysis doesn't get held hostage by a single flaky dependency.
2.3 seconds between the question and the root cause.
Not a box diagram. It is the trace of a real investigation. Each bar is a call WhyStack orchestrates: parallel fan-out across your stack, cross-source correlation, PII filtering. The answer comes back with evidence, never raw data.
Categories, not vendors. Your stack is the starting point.
Every connector listed below already exists. And where a category has more than one, the architecture abstracts it: Datadog, Grafana or SigNoz; AWS, GCP or Magalu Cloud. Whatever your stack is missing, we wire up on demand in the same pattern.
More than answering questions
WhyStack also investigates incidents on its own, keeps the map of your infrastructure, follows your cost and measures behavior between versions. With the same rule as its answers: what it could not read, it says it did not read.
Incident diagnosis on its own
When an alert arrives from PagerDuty, WhyStack investigates across your stack, posts the diagnosis to Slack and publishes the post-mortem. The document is only marked verified when the evidence it read supports the cause; otherwise it stays a hypothesis.
The map of your infrastructure
The Agents keep the graph of your resources across every account and cloud, and the service topology is learned from traces. Click a resource to see what goes down with it, and the map tells you when a reading is out of date.
Cost with a likely cause
Finds the day the cost went up and what changed around it (deploys, Argo CD syncs, PRs), presented as a hypothesis, never as the cause. It also right-sizes Kubernetes requests from real usage and points out storage waste.
Behavior between versions
The Profiler compares how a process behaves from one version to the next and tells you whether the change is above the noise. It is optional, installed separately, and only works after someone on your team enables it.
What the team sees.
What happens behind it.
On the left, the conversation as the team lives it: a question, an answer with evidence. On the right, what WhyStack executes on your infra at each moment, including the story's only write, which never happens without human approval.
What you can do in a single conversation
Real scenarios: incident investigation, cost spike, deploy risk, performance, observability gap, topology, order trace, conversion drop, SLO design, multi-account audit. Each one was recorded on a production case and shows the tool solving it end-to-end.
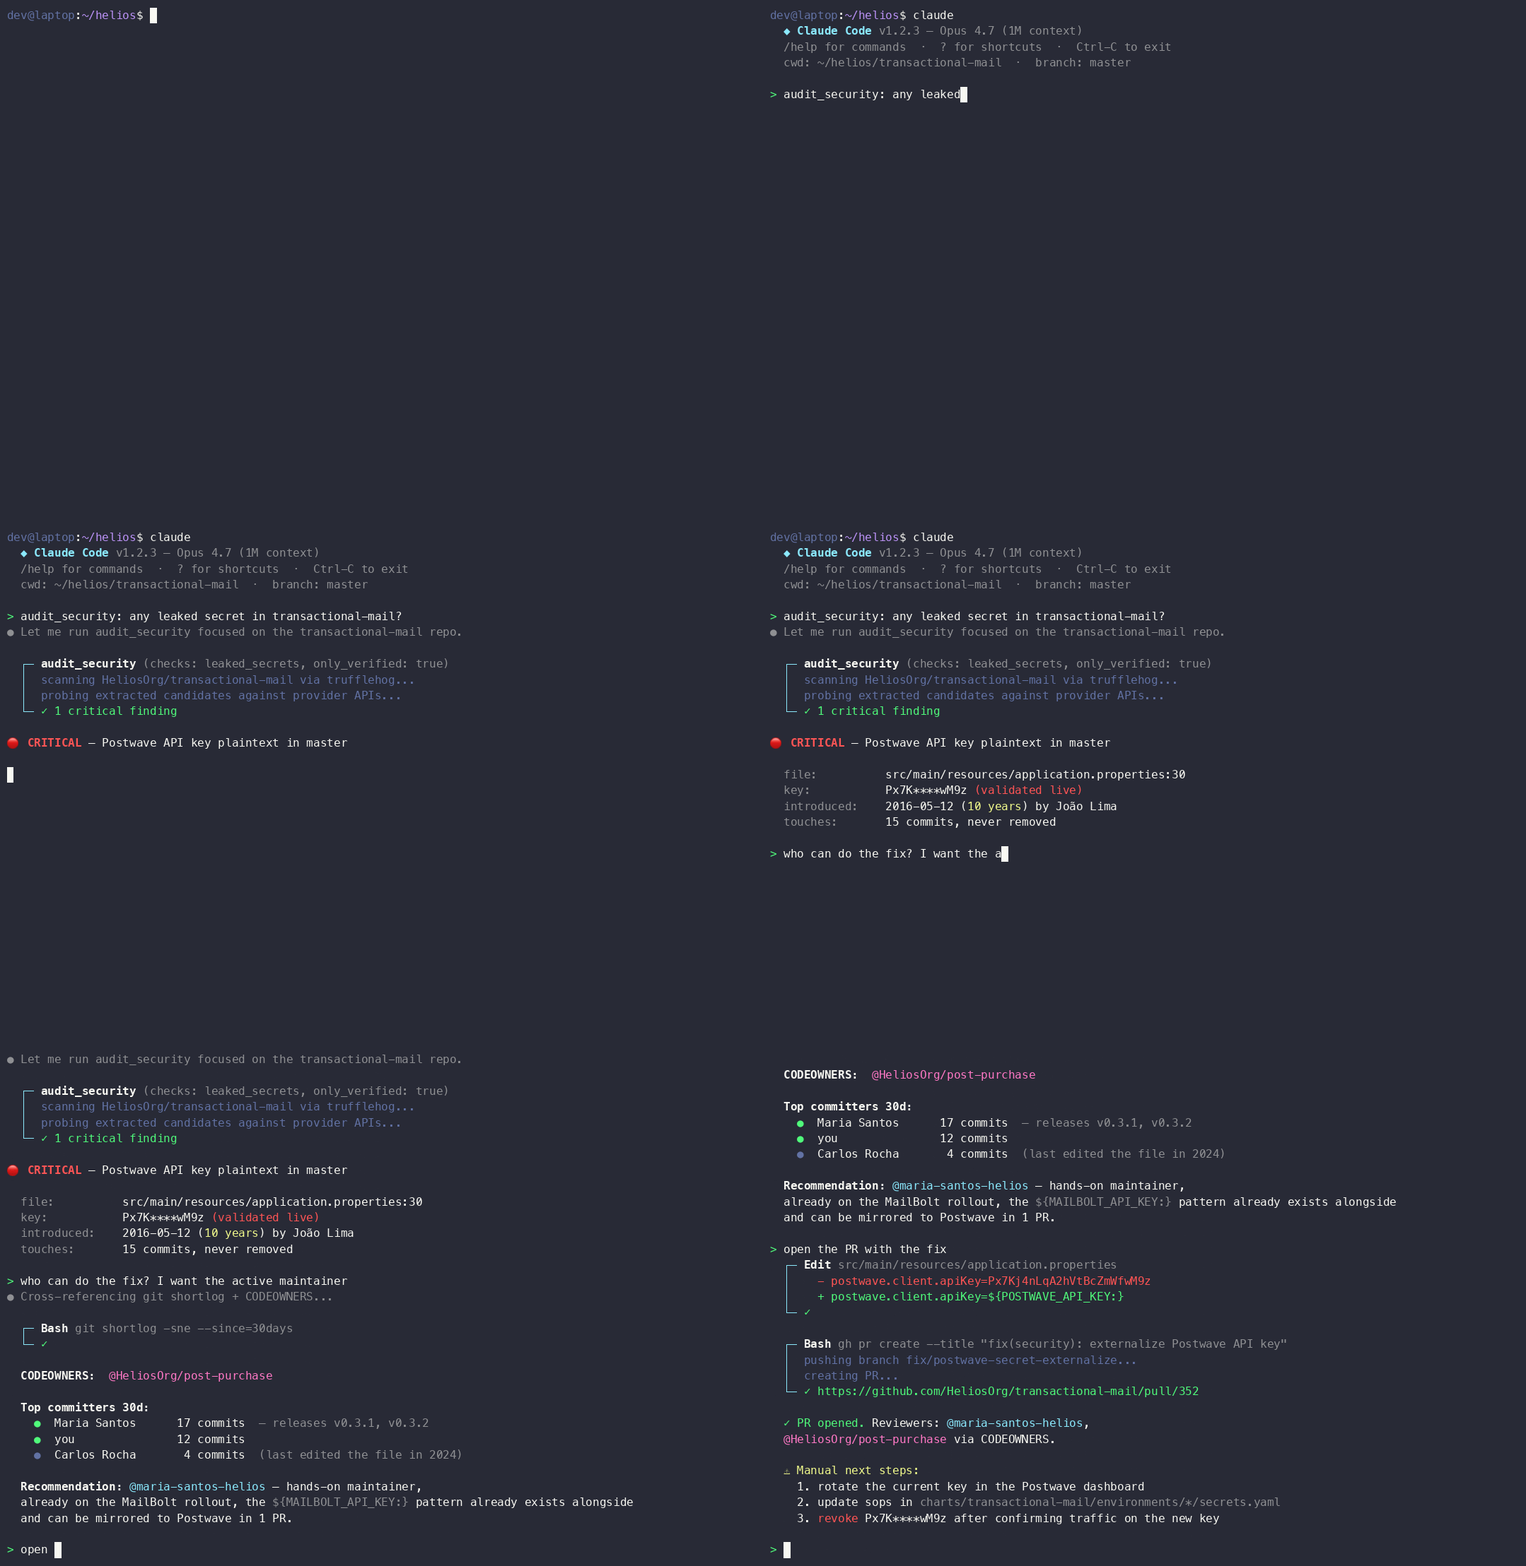
End-to-end security audit
Finds a 10-year-old secret in code, validates it live against the provider and identifies the repo's active maintainer. In the same conversation, your assistant opens the rotation PR.
Composition in numbers
Common questions
Any MCP (Model Context Protocol) client. Today we run on Claude Code, Claude Desktop, Cursor and ChatGPT (with MCP enabled). As other assistants adopt the protocol, they start working without any server change. MCP is precisely the layer that makes this plug-and-play.
Composition. Instead of the AI orchestrating N different MCPs (one per SaaS) and correlating manually, one tool like investigate_incident already crosses APM + monitors + logs + pod memory + deploys + recent PRs in one call. Fewer round-trips, more signal, context already shaped for the model's reasoning.
Redaction happens at the Agent, inside your network, before any result leaves: emails, CPFs, IPs, card numbers and phone numbers are removed and never reach us or the LLM. It is a single enforcement point, with an audit log of every redaction. In production with real data, the Agent refuses to start with redaction turned off, and any Agent running without it is flagged in the fleet view.
It won't. The infrastructure and observability connectors (AWS, GCP, Magalu Cloud, Kubernetes, Datadog, Grafana, SigNoz and the rest) are read-only by architecture: they don't even expose write methods. The only 5 tools that write create records where your team already works: a Jira ticket (create or update), a Slack message or channel, and a GitHub issue. Each call requires explicit confirmed: true and is recorded in the audit log.
In two parts. The Agent runs in your infrastructure, reads credentials from your secret manager and keeps them in memory only: they never leave your environment. It connects outbound, with no inbound port open, and redacts personal data before any result leaves. The MCP server and the intelligence run in our cloud and receive only those redacted results. We do the setup alongside your team: minimum-permission validation and onboarding on the first sessions.
The architecture is extensible by design. We integrate on demand: New Relic, GitLab, Bitbucket, Linear, Kafka, Snowflake, whatever your team uses. Each new connector becomes an MCP tool in the same pattern as the existing ones, and composites start cross-referencing it automatically. Contact us to align priorities.
Ready to see it in your setup?
Leave a contact and we will set up a pilot with your team, using the credentials you already have, on your infrastructure, with the catalog curated for the services that matter to you.
No spam. We'll only use your contact to talk about the pilot.